Performance testing
This project is no longer under development.
See the project README for more details.
This page takes you through the tools you can use to measure your application’s performance.
Loading performance
pwa-starter-kit is built using the PRPL pattern, which is a new approach for structuring and serving PWAs, with an emphasis on performance. It stands for:
- Push critical resources for the initial URL route. This is achieved by using HTTP2 push, and covered in the Building and Deploying section.
- Render initial route. In order to get render the requested page as quickly as possible, each route should only load exactly what it needs, and not any resources that are needed by other, yet un-requested parts of the app.
- Pre-cache remaining routes. Once the requested page has loaded, a Service Worker will be installed and it will pre-cache the fragments specified in your polymer.json.
- Lazy-load and create remaining routes on demand. When the user switches routes, the app lazy-loads any required resources that haven’t been cached yet by the Service Worker, and creates the views.
Lazy-loading
Lazy loading is an important aspect of pwa-starter-kit, since it makes sure each route only loads exactly what it needs to render something to the screen, and any extra work is done afterwards. There are several places in the app where this is done:
Lazy-loading routes
The actual JavaScript code for each route is only loaded if that route is requested. This is done in the loadPage action creator, which is called any time you perform a navigation.
Lazy-loading reducers
If a route is connected to the Redux store, since it is lazy-loaded, then its reducers must be as well. The Redux and state management page covers how to set up your store to accommodate lazy loading reducers, and gives you an example of how this is done in pwa-starter-kit.
Measuring performance
There are a few tools to help you measure and automate your performance measurements.
Lighthouse
Lighthouse is an open source tool that helps you measure and improve the performance of your page. It comes as a Chrome DevTools extension or a node module, so that you can run it in the command line (and integrated it with your other automated Node testing). Once it’s ran, it gives you an overall score, and suggestions for each area of improvement:

WebPageTest
WebPageTest is an application that loads your page on an actual Moto G4 device with a slow 3G connection, and then gives you a details report on the page’s load performance in that scenario. It is very useful to see how your application performs in a real-world, non-testing environment.
For example here is a run testing the deployed pwa-starter-kit.
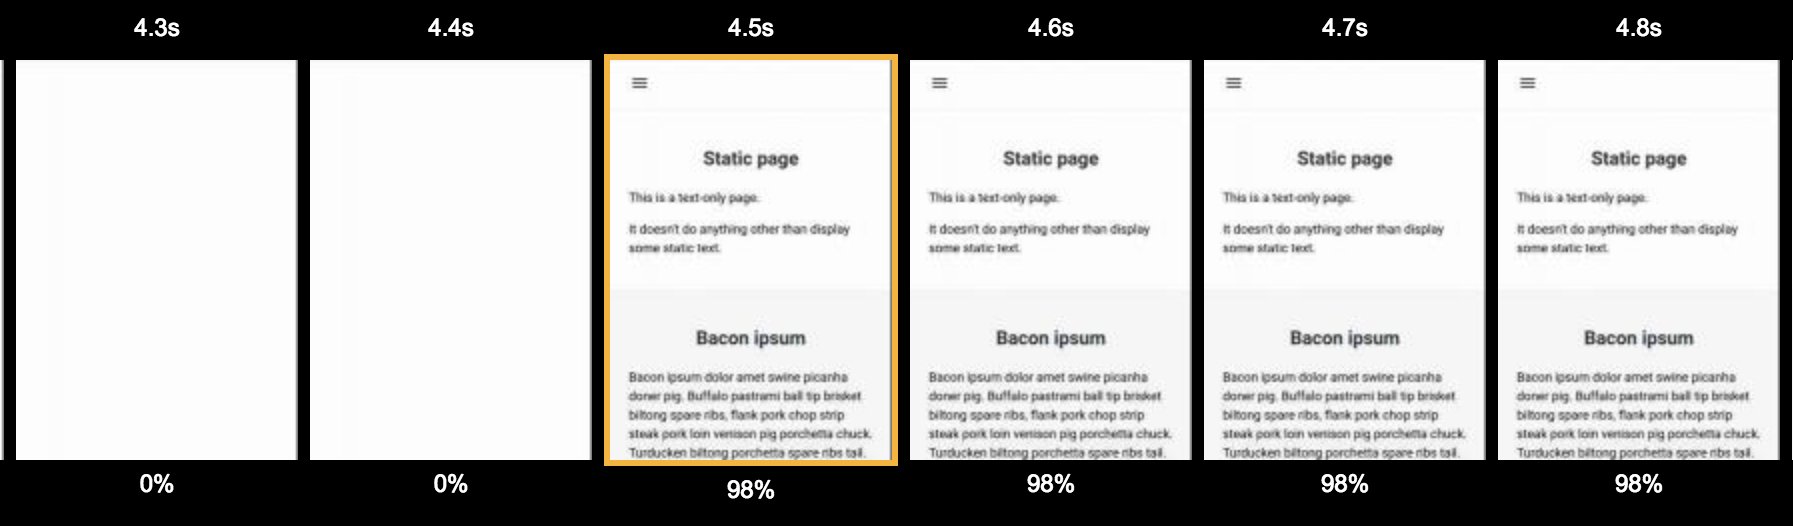
In particular, the film strip view is very useful, since it shows you a timeline of when your application actually first paints to the screen:
Interactive timeline of your resources loading, and who generated the requests:
